New Intuit Mailchimp research explores how brands are responding to overcrowded messaging moments, and ways intelligent marketing is helping them cut through the static.

New data from 44 billion messages
Breaking Through Peak Season Noise Report
New Intuit Mailchimp research explores how brands are responding to overcrowded messaging moments, and ways intelligent marketing is helping them cut through the static.
Years of heavy Black Friday Cyber Monday (BFCM) marketing promos have turned the biggest shopping weekend of the year into the hardest place for any brand to be heard. Brands compete to show up in email inboxes, text messages, phone lock screens, AI search results, and advertising.
New research from Mailchimp analyzed over 44 billion email messages and 83 million text messages sent during peak season, between Halloween and New Year’s Eve 2025, to see what helped brands break through the noise and generate more than $1B in revenue. The common thread was intelligent marketing.

The narrative around BFCM marketing used to be ‘more, more, more’. Now, what we’re seeing is that the brands adopting intelligent marketing, using AI and automation to segment and personalize messages at scale, are getting through to high-value consumers. Q4 is the biggest opportunity throughout the year to bring new eyes to your brand, but it’s only the start. How you engage customers in the months that follow can set your brand up for success for the entire year.
Throughout the report, we reference internal Mailchimp data from peak season 2025. Individual results and regional feature availability vary. Availability of features and functionality varies by plan type. For complete details, view our methodology and disclaimers.
Peak season includes the biggest shopping days of the year, and it spans from October 31 to December 31. It’s a time when brands can attract new consumers, engage existing customers, drive retention, and gather insights to fuel their strategy after the holidays.
We pulled out what separates the top performers from the rest.
Oct 31
Dec 31

Days

Email and SMS orders

In gross revenue
No surprise, email drove the majority of revenue during peak season, largely because brands send more emails than SMS messages. Throughout peak season 2025, Mailchimp customers sent over 500x more marketing emails than text messages.¹
But SMS is quickly growing as a high-value channel. SMS message order rates landed between 0.03% and 0.25% during peak season 2025, while email order rates were between 0.01% and 0.04%.
From October 31 to December 31, 2025, text messages outperformed email:
6x higher order rates, at peak
3x higher revenue per message


| Metric | Value |
|---|---|
| Gross revenue | $1,132,707,426.53 |
| Revenue per order | $151.90 |
| Order rate | 0.02% |
| Revenue per message | $0.03 |
| Metric | Value |
|---|---|
| Gross revenue | $8,219,537.10 |
| Revenue per order | $127.71 |
| Order rate | 0.08% |
| Revenue per message | $0.10 |
How brands can break through
How brands can break through
How brands can break through
How brands can break through
How brands can break through
How brands can break through
How brands can break through
How brands can break through
How brands can break through
How brands can break through
How brands can break through
How brands can break through
How brands can break through
How brands can break through
How brands can break through
How brands can break through
How brands can break through
How brands can break through
If you haven't added SMS or WhatsApp, it's likely the single fastest engagement lift available before this peak season.²
Start collecting opt-ins now:
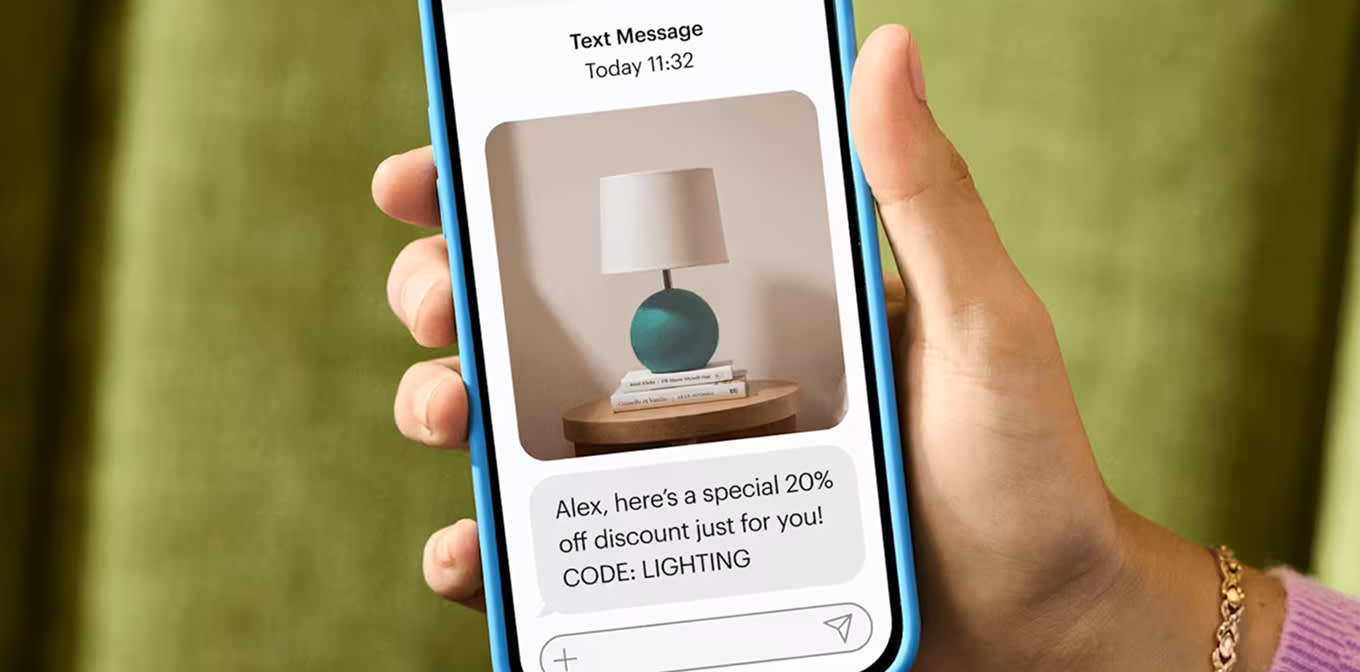
Consumers clicked text messages 8x more than email per message delivered during peak season 2025
RELATED READING
REAL BRAND STORIES
Fitness brand Gymwrap consolidated email and SMS onto one platform before ramping up for the holidays, creating a single source of truth for customer data and better targeting engaged customers with automations³.
 142x
ROI on first SMS launch
142x
ROI on first SMS launch
 30%
of revenue attributed to Mailchimp
30%
of revenue attributed to Mailchimp
The holidays see high levels of marketing activity year over year, which could be contributing to email fatigue over the course of peak season. According to Mailchimp’s The New Ecommerce Calendar, 39% of global shoppers are overwhelmed by the number of sales and deals, and 25% of global shoppers avoid shopping during big sales events altogether.
Conversion rates peak during Cyber Week and slow down as the season continues. And as attention wanes, many brands increase their email sending. But this may not be the best strategy. We’ve seen that brands with high engagement actually send less.
While email engagement tapers off, text messages stay strong even through Cyber Week.
Among all Mailchimp users during BFCM 2025⁴:
10% average click rate
1.2% average click rate
And these top performers (by click rate) did it while sending 56x fewer emails.
Among all Mailchimp users during peak season 2025:
5.4M total texts sent
1.125M average texts sent per day

And Black Friday texts maintained a 16.2% click rate, 3% higher than the average during peak season.
How brands can break through
How brands can break through
How brands can break through
How brands can break through
How brands can break through
How brands can break through
How brands can break through
How brands can break through
How brands can break through
How brands can break through
How brands can break through
How brands can break through
How brands can break through
How brands can break through
How brands can break through
How brands can break through
How brands can break through
How brands can break through
Early on in the holiday season, shoppers are more open to clicking and converting on email, while SMS engagement spikes on a rolling basis.
Optimize your messaging during peak season:

The top holidays:
RELATED READING
While it may seem that Black Friday weekend would be the best opportunity to connect with consumers, it’s also the most active across brands. For consumers, it’s information overload (on top of shopping decision paralysis), and every “Black Friday flash sale, 24 hours only!” email starts to feel the same.
Black Friday and Cyber Monday are still major shopping days. Mailchimp’s Holiday Shopping Unwrapped report found that 75% of global shoppers made a purchase on Black Friday and 37% did so on Cyber Monday.
After just over 20 years of BFCM weekend as we know it, the demand is still there, but brands have to rethink how they break through these key shopping moments.

November 20 - December 8
| Date | Messages sent |
|---|---|
| Nov 20 | 953M |
| Nov 21 | 947M |
| Nov 22 | 411M |
| Nov 23 | 364M |
| Nov 24 | 891M |
| Nov 25 | 1.03B |
| Nov 26 | 1.01B |
| Nov 27 | 930M |
| Nov 28 | 1.39B |
| Nov 29 | 542M |
| Nov 30 | 566M |
| Dec 1 | 1.30B |
| Dec 2 | 1.15B |
| Dec 3 | 875M |
| Dec 4 | 922M |
| Dec 5 | 887M |
| Dec 6 | 395M |
| Dec 7 | 340M |
| Dec 8 | 707M |
| Date | Messages sent |
|---|---|
| Nov 20 | 1.27M |
| Nov 21 | 1.75M |
| Nov 22 | 636K |
| Nov 23 | 462K |
| Nov 24 | 1.54M |
| Nov 25 | 1.90M |
| Nov 26 | 1.65M |
| Nov 27 | 1.52M |
| Nov 28 | 5.43M |
| Nov 29 | 1.56M |
| Nov 30 | 939K |
| Dec 1 | 3.41M |
| Dec 2 | 2.43M |
| Dec 3 | 1.89M |
| Dec 4 | 1.81M |
| Dec 5 | 2.47M |
| Dec 6 | 664K |
| Dec 7 | 490K |
| Dec 8 | 1.46M |
How brands can break through
How brands can break through
How brands can break through
How brands can break through
How brands can break through
How brands can break through
How brands can break through
How brands can break through
How brands can break through
How brands can break through
How brands can break through
How brands can break through
How brands can break through
How brands can break through
How brands can break through
How brands can break through
How brands can break through
How brands can break through
There’s no official Cyber Week/BFCM weekend day on Sunday, and it’s a wide open space with less activity in the inbox and on lock screens.
Make it your own:

Mailchimp customers sent
59% fewer emails
83% fewer text messages
On Sunday, November 30, 2025 (compared to Friday, November 28, 2025)
RELATED READING
For Mailchimp customers, the shoulder days surrounding BFCM 2025 drove higher average email open rates and higher email and SMS click rates, likely because they’re less crowded.
As you send out messages during this hyper-busy time period, keep an eye on engagement.
Per message sent during BFCM 2025:⁵
15.7% average click rate
1.4% average click rate

On average during peak season 2025, consumers clicked text messages 8x more than email per message delivered.
For Mailchimp customers who sent both email and SMS campaigns during BFCM 2025, SMS drove nearly 20% of their total combined e-commerce revenue ($1.6M of $8.2M)—a larger share than for users sending SMS alone. The two channels cover for each other.⁶
November 26 - December 2
| Date | Click rate |
|---|---|
| Nov 26 | 1.61% |
| Nov 27 | 1.51% |
| Nov 28 | 1.3% |
| Nov 29 | 1.22% |
| Nov 30 | 1.27% |
| Dec 1 | 1.58% |
| Dec 2 | 1.59% |
| Date | Click rate |
|---|---|
| Nov 26 | 14.1% |
| Nov 27 | 15.1% |
| Nov 28 | 16.2% |
| Nov 29 | 15.1% |
| Nov 30 | 16.6% |
| Dec 1 | 17.3% |
| Dec 2 | 15.4% |
November 20 - December 8
| Date | Revenue per message |
|---|---|
| Nov 20 | $0.02 |
| Nov 21 | $0.02 |
| Nov 22 | $0.03 |
| Nov 23 | $0.04 |
| Nov 24 | $0.02 |
| Nov 25 | $0.02 |
| Nov 26 | $0.02 |
| Nov 27 | $0.03 |
| Nov 28 | $0.03 |
| Nov 29 | $0.05 |
| Nov 30 | $0.05 |
| Dec 1 | $0.03 |
| Dec 2 | $0.02 |
| Dec 3 | $0.02 |
| Dec 4 | $0.02 |
| Dec 5 | $0.02 |
| Dec 6 | $0.03 |
| Dec 7 | $0.03 |
| Dec 8 | $0.02 |
| Date | Revenue per message |
|---|---|
| Nov 20 | $0.11 |
| Nov 21 | $0.09 |
| Nov 22 | $0.18 |
| Nov 23 | $0.26 |
| Nov 24 | $0.11 |
| Nov 25 | $0.09 |
| Nov 26 | $0.10 |
| Nov 27 | $0.13 |
| Nov 28 | $0.12 |
| Nov 29 | $0.28 |
| Nov 30 | $0.22 |
| Dec 1 | $0.16 |
| Dec 2 | $0.13 |
| Dec 3 | $0.08 |
| Dec 4 | $0.10 |
| Dec 5 | $0.06 |
| Dec 6 | $0.18 |
| Dec 7 | $0.17 |
| Dec 8 | $0.07 |
How brands can break through
How brands can break through
How brands can break through
How brands can break through
How brands can break through
How brands can break through
How brands can break through
How brands can break through
How brands can break through
How brands can break through
How brands can break through
How brands can break through
How brands can break through
How brands can break through
How brands can break through
How brands can break through
How brands can break through
How brands can break through
First-time buyers are primed to spend more right now, but only if you build for what happens after the sale.
Turn one purchase into a relationship:

New customers had:
21% higher average order value via email
39% higher average order value via SMS
than repeat customers, during BFCM 2025
RELATED READING
REAL BRAND STORIES
For C3 Presents, which produces festivals like Lollapalooza and Bonnaroo, SMS is their single highest-revenue channel. Moving to a consolidated email and SMS platform to send time-sensitive sales messages and lineup announcements helped them reach their goals.
 40%
Estimated cost savings after consolidating to one platform
40%
Estimated cost savings after consolidating to one platform
 30M+
SMS texts delivered in 6 months
30M+
SMS texts delivered in 6 months
Peak season success comes from more than raw volume. Successful brands send when shoppers are ready to buy, and send to the people most likely to act.

During peak season 2025:
2x higher order rates on weekends compared to weekdays
— —
While email order rates spiked during BFCM weekend, text message order rates peaked two weekends before. In 2025, 11 of the 12 key shopping days during peak season fell on weekdays. But Mailchimp customers saw their highest email and SMS order rates on weekends during peak season 2025.
Most brands pulled back when customers were most ready to buy. Brands cut weekend send volume roughly 60% below weekdays last year. Weekend inboxes carry fewer competing messages, so an audience that’s ready to buy, outside the work week, may pay closer attention to your brand.
During peak season 2025, emails sent by Mailchimp customers that used generative AI saw:
+50% order rate
+33% conversion rate
During BFCM, emails that used segmentation and personalization drove 11% higher average order value than those that didn’t ($166 vs. $150). Emails built with generative AI showed a similar pattern, with higher order rates and conversion rates compared to standard sends.⁷
Yet targeting still wasn’t the default. More than 6 billion of the 44 billion-plus emails sent during peak season 2025 used personalization, meaning most brands were still sending one-size-fits-all blasts.
October 31 - December 31
| Date | Order rate |
|---|---|
| Oct 31 | 0.01% |
| Nov 1 | 0.03% |
| Nov 2 | 0.03% |
| Nov 3 | 0.02% |
| Nov 4 | 0.01% |
| Nov 5 | 0.01% |
| Nov 6 | 0.01% |
| Nov 7 | 0.01% |
| Nov 8 | 0.02% |
| Nov 9 | 0.03% |
| Nov 10 | 0.01% |
| Nov 11 | 0.02% |
| Nov 12 | 0.01% |
| Nov 13 | 0.01% |
| Nov 14 | 0.01% |
| Nov 15 | 0.03% |
| Nov 16 | 0.03% |
| Nov 17 | 0.02% |
| Nov 18 | 0.01% |
| Nov 19 | 0.01% |
| Nov 20 | 0.01% |
| Nov 21 | 0.02% |
| Nov 22 | 0.03% |
| Nov 23 | 0.03% |
| Nov 24 | 0.02% |
| Nov 25 | 0.02% |
| Nov 26 | 0.02% |
| Nov 27 | 0.02% |
| Nov 28 | 0.03% |
| Nov 29 | 0.04% |
| Nov 30 | 0.04% |
| Dec 1 | 0.02% |
| Dec 2 | 0.02% |
| Dec 3 | 0.01% |
| Dec 4 | 0.01% |
| Dec 5 | 0.01% |
| Dec 6 | 0.03% |
| Dec 7 | 0.03% |
| Dec 8 | 0.02% |
| Dec 9 | 0.01% |
| Dec 10 | 0.01% |
| Dec 11 | 0.01% |
| Dec 12 | 0.02% |
| Dec 13 | 0.03% |
| Dec 14 | 0.03% |
| Dec 15 | 0.02% |
| Dec 16 | 0.01% |
| Dec 17 | 0.01% |
| Dec 18 | 0.01% |
| Dec 19 | 0.01% |
| Dec 20 | 0.02% |
| Dec 21 | 0.02% |
| Dec 22 | 0.01% |
| Dec 23 | 0.01% |
| Dec 24 | 0.01% |
| Dec 25 | 0.01% |
| Dec 26 | 0.02% |
| Dec 27 | 0.02% |
| Dec 28 | 0.02% |
| Dec 29 | 0.01% |
| Dec 30 | 0.01% |
| Dec 31 | 0.01% |
| Date | Order rate |
|---|---|
| Oct 31 | 0.09% |
| Nov 1 | 0.23% |
| Nov 2 | 0.13% |
| Nov 3 | 0.1% |
| Nov 4 | 0.06% |
| Nov 5 | 0.08% |
| Nov 6 | 0.05% |
| Nov 7 | 0.08% |
| Nov 8 | 0.14% |
| Nov 9 | 0.13% |
| Nov 10 | 0.09% |
| Nov 11 | 0.06% |
| Nov 12 | 0.07% |
| Nov 13 | 0.06% |
| Nov 14 | 0.1% |
| Nov 15 | 0.25% |
| Nov 16 | 0.16% |
| Nov 17 | 0.1% |
| Nov 18 | 0.05% |
| Nov 19 | 0.06% |
| Nov 20 | 0.07% |
| Nov 21 | 0.08% |
| Nov 22 | 0.14% |
| Nov 23 | 0.17% |
| Nov 24 | 0.08% |
| Nov 25 | 0.08% |
| Nov 26 | 0.07% |
| Nov 27 | 0.09% |
| Nov 28 | 0.08% |
| Nov 29 | 0.18% |
| Nov 30 | 0.16% |
| Dec 1 | 0.11% |
| Dec 2 | 0.08% |
| Dec 3 | 0.06% |
| Dec 4 | 0.08% |
| Dec 5 | 0.09% |
| Dec 6 | 0.19% |
| Dec 7 | 0.15% |
| Dec 8 | 0.07% |
| Dec 9 | 0.08% |
| Dec 10 | 0.04% |
| Dec 11 | 0.04% |
| Dec 12 | 0.07% |
| Dec 13 | 0.12% |
| Dec 14 | 0.09% |
| Dec 15 | 0.04% |
| Dec 16 | 0.03% |
| Dec 17 | 0.04% |
| Dec 18 | 0.05% |
| Dec 19 | 0.05% |
| Dec 20 | 0.11% |
| Dec 21 | 0.09% |
| Dec 22 | 0.03% |
| Dec 23 | 0.04% |
| Dec 24 | 0.06% |
| Dec 25 | 0.09% |
| Dec 26 | 0.05% |
| Dec 27 | 0.07% |
| Dec 28 | 0.08% |
| Dec 29 | 0.04% |
| Dec 30 | 0.04% |
| Dec 31 | 0.05% |
During peak season 2025, a few email features helped brands stand out in the inbox, some more than others. These features may help improve performance in 2026.
GENERATIVE AI EMAILS
Order rate during peak season 2025
GENERATIVE AI EMAILS
conversion rates during peak season 2025
GENERATIVE AI EMAILS
emails sent during peak season 2025
ABANDONED CART BLOCK
open rate during BFCM 2025
ABANDONED CART BLOCK
click rate during BFCM 2025
SEGMENTATION
average order value during BFCM 2025
SEGMENTATION
emails during peak season 2025
PERSONALIZATION
average order value during BFCM 2025
PERSONALIZATION
emails during peak season 2025
VIDEOS
click rate during BFCM 2025
IMAGES
click rate during BFCM 2025
IMAGES
emails during BFCM 2025
During peak season 2025, a few SMS features helped brands stand out on phone lock screens. Mailchimp customers that segmented their SMS messages saw 6% higher click rates, and users saw benefits from different text message types—SMS has both the highest click rate and the highest unsubscribe rate, while RCS has a lower click rate and a lower unsubscribe rate.

How brands can break through
How brands can break through
How brands can break through
How brands can break through
How brands can break through
How brands can break through
How brands can break through
How brands can break through
How brands can break through
How brands can break through
How brands can break through
How brands can break through
How brands can break through
How brands can break through
How brands can break through
How brands can break through
How brands can break through
How brands can break through
A handful of features made an outsized difference in performance last peak season, and most last year didn’t use them.
Try these before your next send:
Emails using generative AI during peak season had:
50% order rate
33% conversion rates
RELATED READING
REAL BRAND STORIES
Rather than blasting its full list, Priority Bicycles built a segment of recently engaged shoppers, then layered on an abandoned cart flow with a time-sensitive code.
3x
More abandoned cart conversions quarter over quarter
 $68k+
In marginal revenue from one targeted bundle campaign
$68k+
In marginal revenue from one targeted bundle campaign
BFCM revenue doesn’t end when the long weekend does. The customers you win now outspend your regulars today, and they typically stay subscribed well after the holidays.
Every subscriber you add to your list early in peak season is a nearly free impression on Black Friday, and every subscriber you add during Cyber Week is a candidate for December gifting sends and post-holiday flows.
From October 31 to December 31, 2025, Mailchimp customers added:
20.6M SMS contacts
516.8M Email contacts

Shoppers wait until deals are imminent before handing over their contact info. Email acquisition trended upward into BFCM, with some of the season’s highest single-day volumes recorded that week. SMS showed an even higher sense of urgency, with massive surges of new opt-ins—spiking anywhere from four to five times the average number of daily contacts added in the first three weeks of November 2025—just days before Black Friday. Both have a second surge in mid December ahead of the holidays.
And those contacts stay. During peak season, Mailchimp customers added over 500M new contacts, and saw 31M unsubscribes, representing approximately 6% of total new contacts added. Audiences built during peak season drove repeat business: 16.6% of new customers acquired during peak season 2025 purchased again in Q1 2026, with a median of 26 days to repurchase.
From Q4 2025 to Q1 2026
16.6% new customers bought again
26 days median for those who repurchased

From Black Friday and Cyber Monday 2025, first-time customers drove higher total spend than returning customers across both SMS and email channels.
During BFCM 2025, new customers had a 21% higher average order value than repeat customers via email ($157.83 vs $129.90), and 39% higher average order value via SMS ($157.68 vs $113.11). Plus, new customers made up 59% of email orders and nearly 70% of SMS orders.
Repeat customers may already have the products they need from that brand, so they shop less. They may also be thinking about timing their purchases throughout the weekend, holding out for Cyber Monday rather than Black Friday (that 40% off deal will drop to 60% off on Monday!) New customers, however, arrive without that history, and often convert on a welcome offer, which lands exactly when they’re already in a shopping state of mind.
November 1 - December 31
| Sun | Mon | Tue | Wed | Thu | Fri | Sat |
|---|---|---|---|---|---|---|
| 31 16M | 1 6.1M | |||||
| 2 5.8M | 3 17M | 4 18M | 5 18M | 6 18M | 7 16M | 8 6.2M |
| 9 6.1M | 10 20M | 11 20M | 12 17M | 13 20M | 14 18M | 15 6.5M |
| 16 6.3M | 17 20M | 18 20M | 19 22M | 20 20M | 21 19M | 22 7.6M |
| 23 6.9M | 24 23M | 25 22M | 26 22M | 27 19M | 28 16M | 29 8.1M |
| 30 9.5M |
| Sun | Mon | Tue | Wed | Thu | Fri | Sat |
|---|---|---|---|---|---|---|
| 1 20M | 2 23M | 3 19M | 4 17M | 5 16M | 6 5.7M | |
| 7 6.3M | 8 17M | 9 19M | 10 18M | 11 19M | 12 16M | 13 6.1M |
| 14 6.1M | 15 18M | 16 22M | 17 21M | 18 20M | 19 25M | 20 9.9M |
| 21 5.1M | 22 18M | 23 16M | 24 8.2M | 25 4.4M | 26 7.0M | 27 4.6M |
| 28 4.8M | 29 10M | 30 11M | 31 9.6M |
| Sun | Mon | Tue | Wed | Thu | Fri | Sat |
|---|---|---|---|---|---|---|
| 31 364K | 1 104K | |||||
| 2 59K | 3 247K | 4 168K | 5 211K | 6 437K | 7 180K | 8 100K |
| 9 32K | 10 246K | 11 239K | 12 207K | 13 239K | 14 232K | 15 78K |
| 16 66K | 17 332K | 18 714K | 19 256K | 20 465K | 21 394K | 22 109K |
| 23 102K | 24 287K | 25 1.2M | 26 1.1M | 27 407K | 28 366K | 29 138K |
| 30 103K |
| Sun | Mon | Tue | Wed | Thu | Fri | Sat |
|---|---|---|---|---|---|---|
| 1 754K | 2 636K | 3 339K | 4 394K | 5 302K | 6 114K | |
| 7 150K | 8 585K | 9 1.1M | 10 561K | 11 340K | 12 330K | 13 408K |
| 14 99K | 15 286K | 16 456K | 17 431K | 18 416K | 19 277K | 20 322K |
| 21 204K | 22 688K | 23 609K | 24 327K | 25 69K | 26 127K | 27 99K |
| 28 99K | 29 449K | 30 215K | 31 342K |
How brands can break through
How brands can break through
How brands can break through
How brands can break through
How brands can break through
How brands can break through
How brands can break through
How brands can break through
How brands can break through
How brands can break through
How brands can break through
How brands can break through
How brands can break through
How brands can break through
How brands can break through
How brands can break through
How brands can break through
How brands can break through
Collect email and SMS opt-ins before Thanksgiving, while shoppers are actively hunting for deals and most willing to hand over their contact info. This season’s list growth is next season’s revenue.
Build your list this way:

Mailchimp customers added 500M+ new contacts during peak season 2025
BFCM is known as marketers’ biggest weekend of the year. It’s intimidating to think that if you don’t have the right strategies in place, you’ll lose out on huge opportunities for revenue and adding new contacts to your lists.
But the reality is, it’s not about one weekend, just like one player missing one shot doesn’t lose the game for the whole team. It’s a sum of everything you do leading up to peak season and what you do after that determines whether it was a success or not.

The industry’s most obsessed-over weekend is also its most crowded, so focus on moments that are generally quieter for brands.
Personalization and segmentation both boost average order value. These help make each sale bigger, not more likely. Make your messages more meaningful rather than just sending more.
Build out your peak season email and SMS creative and automations with help from generative AI, which improved performance. Create testing campaigns ahead of the season, then scale up your most effective messages starting in October.
During peak season, Mailchimp customers added 500M+ new contacts.
Email builds up the season with steady sending; SMS spikes with time-sensitive flash moments. Brands that run both cover the whole season instead of choosing between reach and urgency.

Peak season doesn’t have to be an end-all-be-all moment that’s hit or miss. Think of it as a way to connect with new shoppers and fill the top of your funnel, setting you up for a strong start of the calendar year. Any brand can set themselves apart by using intelligent marketing to reach their most engaged contacts, and with AI lowering the barrier for entry, it’s anyone’s game.
Drive revenue with intuitive marketing analytics, automations, and AI tools that can help you become a top performer during the 2026 peak season.
Report created in collaboration with Datalily.
General scope and observation windows
Unless otherwise noted, metrics presented in this report are based on internal aggregate global data of active Mailchimp free and paid plan users evaluated across two primary observation windows: Peak Season 2025 (October 31, 2025, to December 31, 2025) and Black Friday Cyber Monday (BFCM) 2025 (November 28, 2025, to December 1, 2025).
Regional feature availability
Email metrics reflect global email campaign send activity. Text messaging metrics reflect bulk SMS campaigns sent exclusively in countries where Mailchimp SMS was commercially available during the observation windows. Regional SMS availability varies.
E-commerce metrics and attribution rules
All revenue, gross order value, Average Order Value (AOV), order rate, and conversion rate metrics apply specifically to Mailchimp users with a connected e-commerce store. Revenue metrics reflect gross e-commerce sales synced to Mailchimp and attributable to email and/or SMS campaigns (excluding orders synced via the QuickBooks integration).
Comparative benchmarks & cohort analysis
Performance disclaimer
Past performance does not guarantee future results. Individual merchant results, campaign performance, and revenue impact will vary based on industry, audience size, channel strategy, and execution.
Legal guidelines for screen readers
Screen images simulated. Dramatization.
Data sources and details