Marketing analytics platform
Marketing analytics and reporting tools that drive real results
Use our platform to track performance, monitor trends across email and SMS campaigns, and create campaigns that reach customers who are more likely to engage and convert.
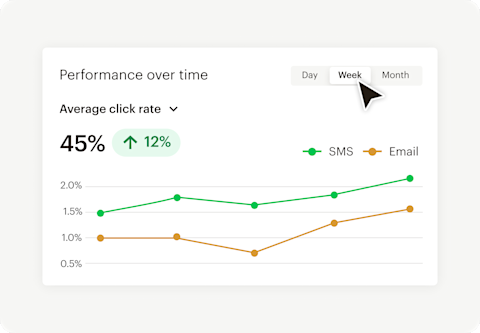
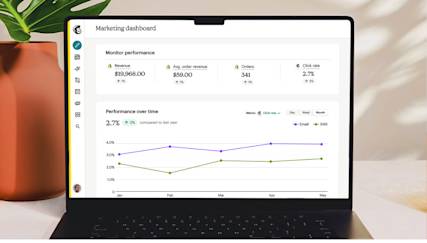
Make smart decisions faster with access to all of your data in one place
Our marketing analytics platform helps you to track real-time stats across your campaigns—including emails and SMS. When you understand how your marketing is performing, you can make more informed decisions about your next steps.

Create engaging, memorable content by better understanding your audience
Get actionable insights about your audience’s behavior with our visualized dashboards. Better understand your subscriber breakdown and discover which ones have clicked and which have converted—so you know who’s responding to what content.

Compare the metrics that matter most
Build customized reports and visualizations to gain more detailed insights on the revenue and engagement metrics that you care about. See the difference over a specified time frame so you can take a more granular look at your marketing performance.
Mailchimp analyzes more than 481 million historical email campaigns across 41 industries to provide personalized recommendations for your campaigns



FAQs
-
A marketing analytics platform is software that collects data from your marketing channels, organizes it, and surfaces it in a way that helps you make better decisions.
Rather than piecing together numbers from separate tools, a good analytics platform brings everything into one place so you can see how your campaigns are performing across email, social, ads, and more.
The value isn't just in the data itself. It's in being able to act on it. When you can see what's working and what isn't, you can stop guessing and start making informed choices about where to focus your time and budget.
If you're new to this space, our guide to choosing the right data analytics tools is a good place to start.
-
Mailchimp provides reporting across all of your marketing channels in one platform. This includes:
- Email: open rates, click rates, revenue, unsubscribes, and industry benchmarking
- Social media: reach, impressions, and engagement across your posted content
- Ads: views, clicks, and ROI for your Facebook and Instagram campaigns
- Landing pages: views, clicks, signups, and revenue generated
- Automations: overall flow performance as well as stats for each individual email in a series
Each report type is tailored to the channel it covers, so the metrics you see are relevant to how that channel actually works. You can see the full breakdown of what's included on our analytics and reporting overview.
-
Yes. Mailchimp's marketing dashboard gives you a unified view of performance across your channels without having to jump between separate reports. Read more about what a marketing dashboard should do and how to get the most out of yours.
Campaign Manager lets you see all your active and scheduled campaigns, from emails to social posts to ads, across a single timeline. For a more tailored view, you can also build custom reports to focus on the specific revenue and engagement metrics that matter most to your business.
-
Campaign benchmarking compares your email performance against other businesses in your industry. Rather than wondering whether a 25% open rate is good or poor, benchmarking gives you context by showing how that number stacks up against peers in your sector.
In Mailchimp, benchmarking data is available directly within your email campaign reports, so you can see at a glance whether your results are above or below average and use that to set realistic improvement goals.
-
Mailchimp's analytics tools aren't just for reviewing the past. They're designed to help you improve future campaigns.
A/B testing lets you compare subject lines, content, or send times to see what drives better results. Multivariate testing takes that further by testing multiple variables at once.
Send time optimization uses your audience's engagement data to recommend the best time to deliver your emails. Predictive segmentation identifies contacts who are most likely to engage or convert, so you can target them with the right message.
If content performance is a priority, our guide to measuring content marketing covers the key metrics worth tracking.
-
Reports tell you what happened. They show you the raw numbers: how many people opened your email, how many clicked, how much revenue a campaign generated. Analytics goes a step further by helping you understand why it happened and what you should do next.
In Mailchimp, both are available in one platform. You can review detailed reports on past performance and use built-in tools like benchmarking, testing, and predictive insights to translate that data into action.
-
Yes. You can connect your Mailchimp account to Google Analytics to track what happens after someone clicks through from your email or landing page.
This lets you see how your Mailchimp campaigns are influencing website behavior, such as which pages people visit, how long they stay, and whether they convert. It's a useful way to connect your email performance data to broader website and revenue metrics. For a broader look at your options, we've also put together a comparison of popular website analytics tools.
-
Mailchimp's analytics platform is self-serve and designed to be accessible without a data background.
But if you want hands-on guidance getting started, Standard and Premium plans include personalized onboarding with a Mailchimp specialist during your first 90 days. They can help you set up tracking, interpret your reports, and build a measurement approach that fits your business. All paid plans also include 24/7 live chat and email support if you have questions along the way.
*Disclaimers
- 481 Million Historical Campaigns: Based on Campaign Analyzer Model for 2004-2024.
- Personalized Onboarding: Onboarding services differ per plan and are available for new or upgraded users with a paid plan for the first 90 days after account creation or upgrade. Onboarding services are currently offered in English, Spanish and Portuguese for Premium plans, and in English for Standard plans.
- Availability of features and functionality varies by plan type. For details, view plans and pricing.